---
author:
- contributor_roles: []
family: Edmunds
given: Scott
url: https://orcid.org/0000-0001-6444-1436
blog:
authors: null
community_id: 52db0518-e228-4260-8c54-c4e323b2569d
created: 1675555200
current_feed_url: null
description: Data driven blogging from the GigaScience editors
doi: https://doi.org/10.59350/gigablog
favicon: https://rogue-scholar.org/api/communities/52db0518-e228-4260-8c54-c4e323b2569d/logo
feed_format: application/atom+xml
feed_url: http://gigasciencejournal.com/blog/feed/atom/
filter: null
generator: Other
home_page_url: https://gigasciencejournal.com/blog
issn: null
language: eng
license: https://creativecommons.org/licenses/by/4.0/legalcode
prefix: '10.59350'
relative_url: null
secure: false
slug: gigablog
status: archived
subfield: '1311'
title: GigaBlog
updated: null
use_api: null
container: GigaBlog
date: '2022-04-21T00:00:00+00:00'
date_updated: '2025-12-06T10:12:18+00:00'
guid: http://gigasciencejournal.com/blog/?p=4399
identifier: https://doi.org/10.59350/26hrn-t8923
image: http://gigasciencejournal.com/blog/wp-content/uploads/2022/04/mike-kenneally-TD4DBagg2wE-unsplash1.jpg
images:
- alt: interactive coffee dataset
height: '488'
sizes: '(max-width: 640px) 100vw, 640px'
src: http://gigasciencejournal.com/blog/wp-content/uploads/2022/04/mike-kenneally-TD4DBagg2wE-unsplash1.jpg
srcset: http://gigasciencejournal.com/blog/wp-content/uploads/2022/04/mike-kenneally-TD4DBagg2wE-unsplash1.jpg,
http://gigasciencejournal.com/blog/wp-content/uploads/2022/04/mike-kenneally-TD4DBagg2wE-unsplash1-300x229.jpg
width: '640'
- height: '512'
sizes: '(max-width: 512px) 100vw, 512px'
src: http://gigasciencejournal.com/blog/wp-content/uploads/2022/04/Julien_Wist-1.jpg
srcset: http://gigasciencejournal.com/blog/wp-content/uploads/2022/04/Julien_Wist-1.jpg,
http://gigasciencejournal.com/blog/wp-content/uploads/2022/04/Julien_Wist-1-300x300.jpg,
http://gigasciencejournal.com/blog/wp-content/uploads/2022/04/Julien_Wist-1-150x150.jpg
width: '512'
- alt: interactive coffee dataset example
height: '371'
sizes: '(max-width: 768px) 100vw, 768px'
src: http://gigasciencejournal.com/blog/wp-content/uploads/2022/04/Fig4-1024x495.png
srcset: http://gigasciencejournal.com/blog/wp-content/uploads/2022/04/Fig4-1024x495.png,
http://gigasciencejournal.com/blog/wp-content/uploads/2022/04/Fig4-300x145.png,
http://gigasciencejournal.com/blog/wp-content/uploads/2022/04/Fig4-768x371.png,
http://gigasciencejournal.com/blog/wp-content/uploads/2022/04/Fig4-1536x743.png,
http://gigasciencejournal.com/blog/wp-content/uploads/2022/04/Fig4-2048x991.png
width: '768'
- src: http://gigasciencejournal.com/blog/wp-content/uploads/2022/04/mike-kenneally-TD4DBagg2wE-unsplash1.jpg
- alt: 'Dr Julien Wist from Universidad del Valle, Cali,
Colombia'
src: http://gigasciencejournal.com/blog/wp-content/uploads/2022/04/Julien_Wist-1.jpg
- alt: 'Browsable spectra example embedded in the paper (interact
with it yourself).'
src: http://gigasciencejournal.com/blog/wp-content/uploads/2022/04/Fig4-1024x495.png
issn: null
keywords:
- Technology
- Agriculture
- Coffee
- GigaByte
- Metabolomics
lang: en
license: https://creativecommons.org/licenses/by/4.0/legalcode
rid: s1hvz-het72
rights: https://creativecommons.org/licenses/by/4.0/legalcode
summary: When coffee is sold as single origin or as the more expensive Arabica beans—
do you really know whether you are getting what you're paying for? Different coffee-producing
regions need to enforce the standards and reputation of their coffee, and there
is a growing industry looking at different technologies to more accurately classify
and test coffee beans from different origins.
title: Waking Up Publishing with Interactive Coffee Data
url: https://wayback.archive-it.org/22098/2025-05-01T17:13:42Z/http://gigasciencejournal.com/blog/interactive-coffee-dataset
version: v1
---
When coffee is sold as single origin or as the more expensive Arabica
beans--- do you really know whether you are getting what you\'re paying
for? Different coffee-producing regions need to enforce the standards
and reputation of their coffee, and there is a growing industry looking
at different technologies to more accurately classify and test coffee
beans from different origins. Researchers in Columbia at the
universities Universidad del Valle and Universidad del Atlantico, and
the company Almacafe have taken steps toward making it easier for the
industry to validate the variety under which the coffee is being sold.
For this, they analysed hundreds of coffee samples from multiple
countries using highly sensitive Nuclear Magnetic Resonance (NMR), and
made these data freely available for broad, inexpensive, and interactive
use to look at coffee to see \'what\'s in that cup\'. A [new paper in
*GigaByte*](https://doi.org/10.46471/gigabyte.50) allows just that, and
does it showcasing new interactive features that let you browse this
interactive coffee data in the publication itself. Lead author [Julien
Wist](https://www.cemarin.org/en/julien-wist/) from Universidad del
Valle (pictured) explains more in one of our [author
Q&As](http://gigasciencejournal.com/blog/tag/qa/) here.
::: {.wp-block-image}
Dr Julien Wist from Universidad del Valle, Cali,
Colombia
:::
**Can you tell us about this interactive coffee dataset, and how it was
collected?**\
This dataset was collected by
[Almacafe](https://www.almacafe.com.co/en/about-us/) in Bogota and
analysed at [Universidad del Valle](https://www.univalle.edu.co/) in
Cali, Colombia. The Colombian Coffee Federation must enforce the
Protected Geographical Indication (GPI) that protects Colombian Coffee
high standards of quality. Therefore they have supported several
research projects using different technologies to classify coffee beans
from different origins. To date, I think this is one of the largest
collections of samples and spectra acquired on coffee and it is made
public.
**What insight does NMR data give you, and how would you like people to
use this data?**\
As just mentioned, NMR gave us information about the origin of coffee.
It also became apparent very quickly that NMR can give accurate
information about coffee quality, although this was not the primary goal
of that research. Although roasting is very important as it can ruin the
best beans, it is impossible to make good coffee out of bad beans. Our
research group had a wonderful time working with coffee samples. The
whole lab was, for once, smelling nice, and we could properly cup the
samples we were analysing! Almacafe introduced us to the coffee
business, to cuping and coffee quality and to coffee farming, this was
an amazing journey into the world of coffee. The sample preparation is
so simple that we just prepared coffee, cold for the magnet and hot for
us!\"
> NMR spectra can reach such a resolution and accuracy that it allows to
> detect the impact of external conditions on the composition of coffee
> within a single experiment
**Coffee is such a popular crop, so what applications are there in using
this data to producing a better quality cup?**\
The next step is surely to use NMR and other techniques to follow
sensory profiles and to monitor the outcome of research project aiming
at improving some sensory scores, by using sophisticated fermentation
processes for instance. NMR can be used for exploration of markers, at
very high fields (very expensive, too) and can also be translated with
benchtop (cost effective) low field devices once markers are known. NMR
has been in the chemistry lab for half a century now, mainly for
elucidation of structures. Now we analyse more and more complex samples,
with hundreds of compounds in a single experiment, with applications in
medical research or in agriculture. The non destructive nature of NMR
also makes it invaluable to study dynamic processes *in-situ*.
**Tell us about NMRium, and what can readers get through browsing the
different coffee spectra with it?**\
NMRium is the newest iteration of a project that started 2 decades ago
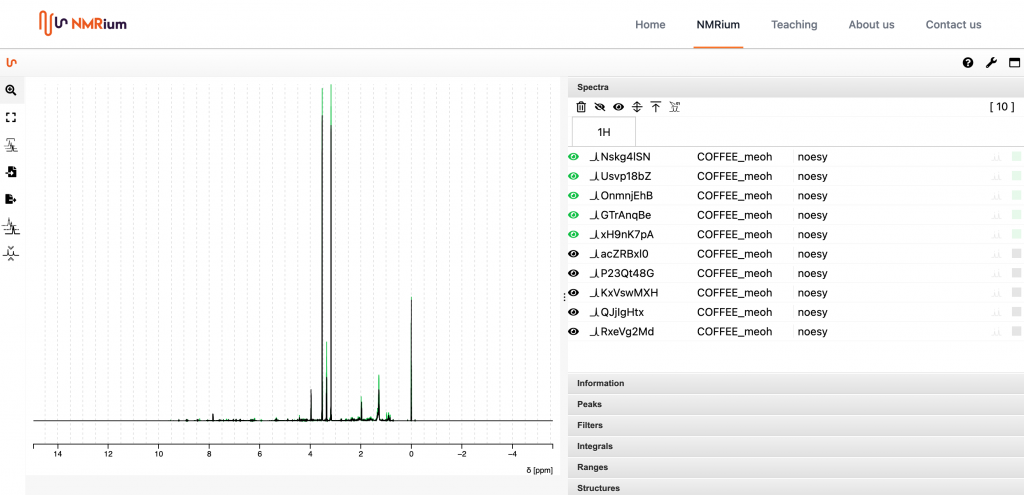
to bring NMR spectra to the browser. If you look at figure 4, anyone can
try to find the signal of caffeine. Arabica beans have a lower content
in caffeine, and it is thus possible to distinguish both arabica and
robusta by just looking at the correct region, t[ry it for
yourself!](https://www.nmrium.org/nmrium#?nmrium=https://dl.dropboxusercontent.com/s/2j4hrqqzuj08og0/arabica-robusta-small.nmrium?dl=0)
(answer: look at the region between 7.83 and 7.87 ppm).
Browsable spectra example embedded in the paper (interact
with it yourself).
Visualisation of data is often difficult and requires expensive pieces
of software. Often, the consequence is that data is overlooked and
simply fed into a black box. I think the first step should always be to
look at the data. NMRium does that in the browser and for free.
**From exploring these datasets yourself have you found anything
interesting?**\
Well we found out that we can indeed tell Colombian coffee apart! You
can keep buying your 100% Colombian coffee safely, or start doing so!
Making large data sets interactive directly within the article is
possible due to the fact that *GigaByte* uses new custom-built,
end-to-end publishing technology that also includes the ability to
integrate interactive content. This ability increases trust in article
content and moves scientific publishing beyond the current standard of
providing articles online, but static, into a living document. On top of
the NMR-viewer in this article, GigaByte articles have other data
visualisation tools such as [Hi-C
maps,](https://doi.org/10.46471/gigabyte.34)[3D imaging
viewers](https://doi.org/10.46471/gigabyte.18) that can run on
VR-headsets, [interactive maps](https://doi.org/10.46471/gigabyte.5) and
[interactive protocols](https://doi.org/10.46471/gigabyte.49), and even
[Executable Research
Articles](http://gigasciencejournal.com/blog/gigabyte-executable-research-articles/).
These types of embedded interactive tools showcase new things that can
be done in publishing, and demonstrate this more hands-on approach as a
way to share research in a manner better suited to communicate modern
research and data.
*For more on the interactive features of GigaByte check out [this
video](https://youtu.be/ltlZ4HdJ1qY).*
**Further Reading**\
Osorio J et al. 1D and 2D NMR spectra of coffee from 27 countries.
*GigaByte*, 2022
The post [Waking Up Publishing with Interactive Coffee
Data](http://gigasciencejournal.com/blog/interactive-coffee-dataset/){rel="nofollow"}
appeared first on
[GigaBlog](http://gigasciencejournal.com/blog){rel="nofollow"}.